
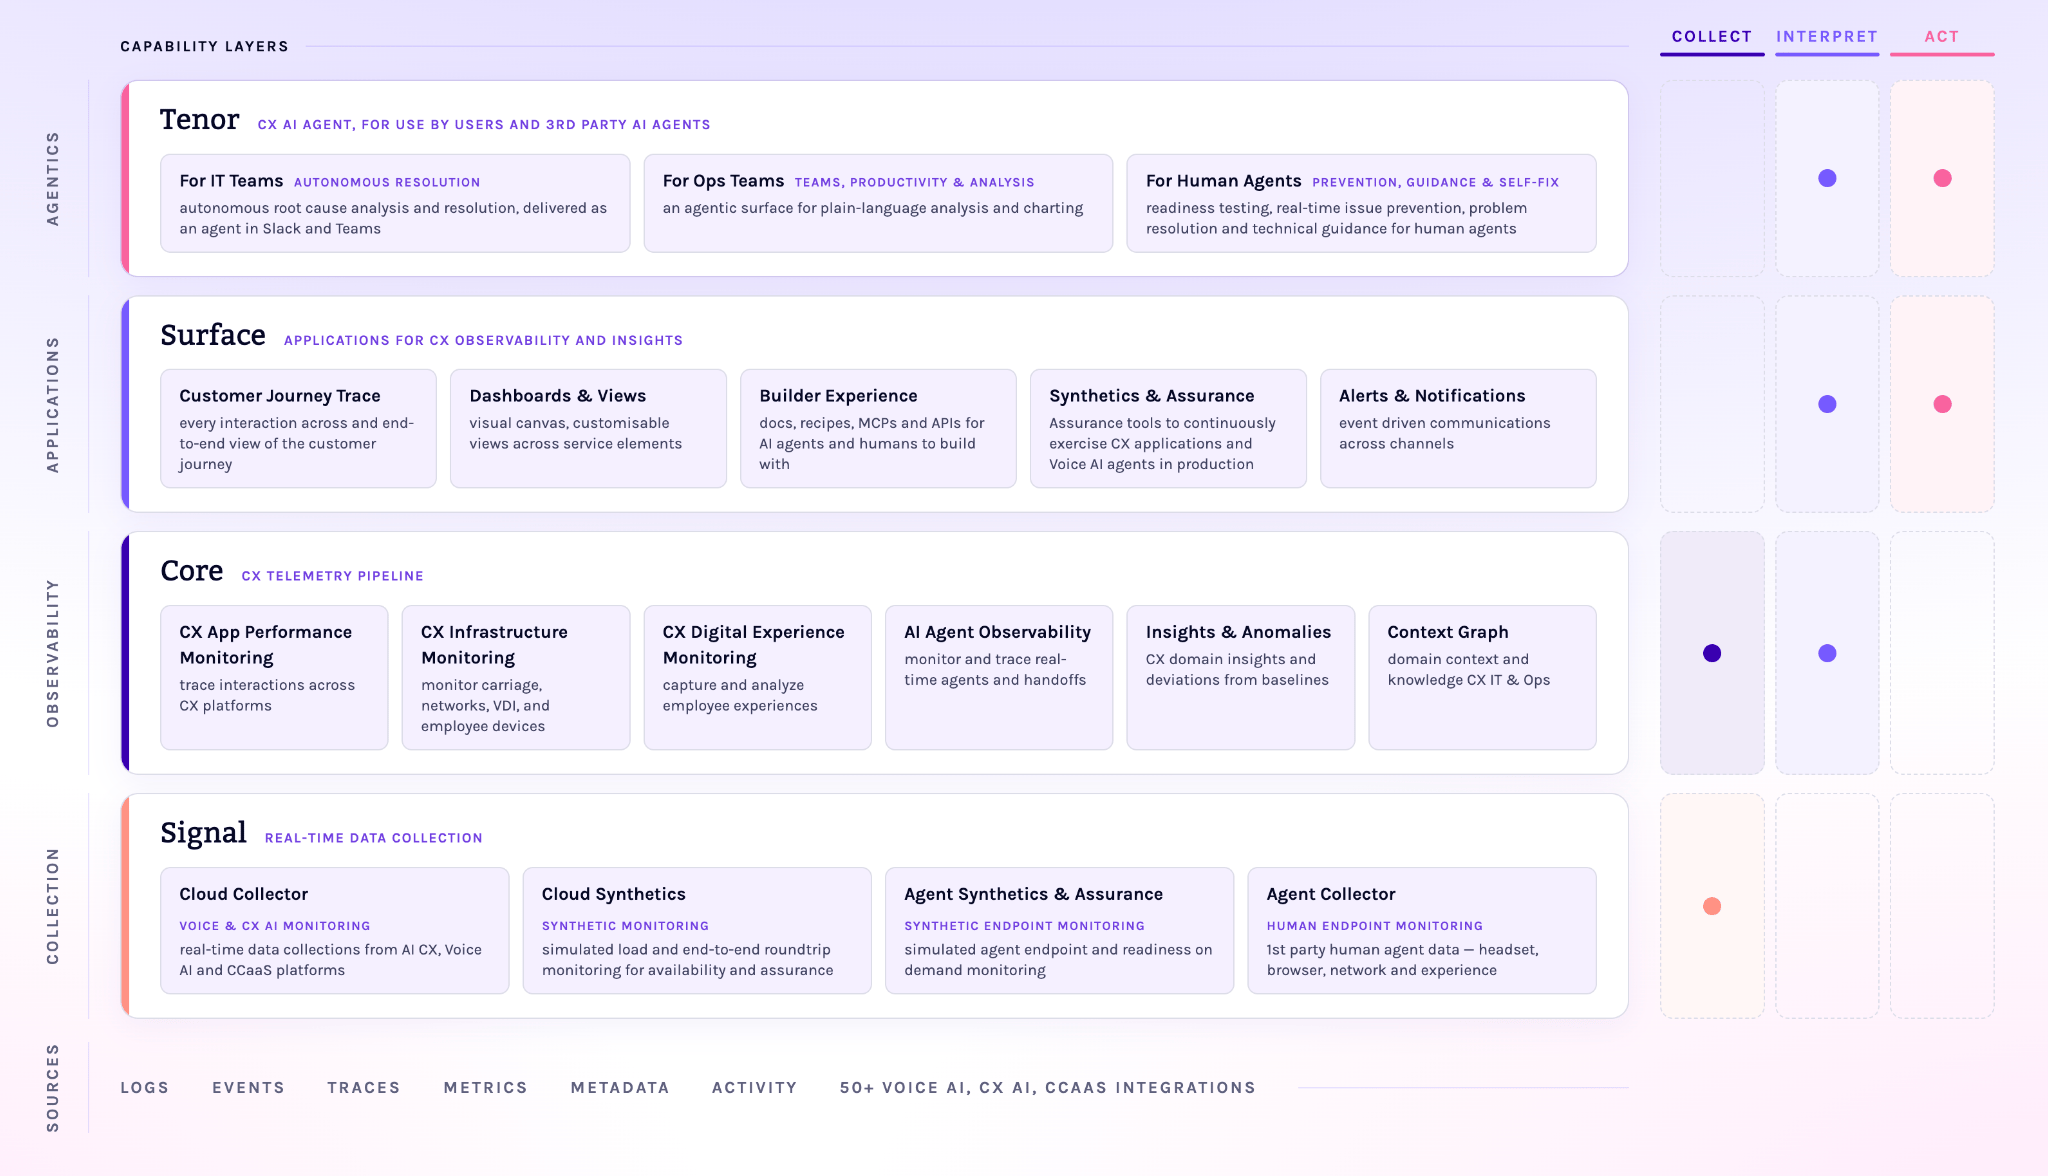
The five layers
Tenor — agentics
The action layer. A CX AI agent that works for people and for other AI agents, delivered where teams already are — Slack, Teams, and the Operata Platform. It splits by audience: autonomous root cause analysis and resolution for IT, plain-language analysis and charting for Ops, and readiness testing, prevention, and technical guidance for human agents. Tenor is available both in the console and through your AI assistant or your own agents.Signal — collection
Real-time data collection from both ends of the interaction. Cloud-side collectors pull from CX AI, Voice AI, and CCaaS platforms. Agent-side collectors capture first-party human agent data — headset, browser, network, and experience. Synthetics and assurance simulate load, round trips, and agent readiness on demand. Four collection types feed Operata.- The Cloud Collector runs in your target collection environment. It collects data in real time, applies your redaction policy, and forwards the result.
- Cloud Synthetics runs synthetic Heartbeat checks and Virtual Agent calls against your application instance.
- The Agent Collector is a browser extension. It emits signals for headset audio levels, network quality, microphone state, page focus, and softphone CTI events — the agent-side measurements no central service can produce.
- Agent Synthetics is integrated into the Agent Collector. It optionally lets human agents run Agent Readiness Tests — a real-world, end-to-end test of their environment.
Surface — applications
Where CX observability becomes usable. End-to-end journey tracing, customizable dashboards and views across service elements, event-driven alerts and notifications across channels, assurance tools that continuously exercise CX apps and Voice AI agents, and a builder experience of docs, recipes, MCP servers, and APIs for humans and AI agents to build on.- Dashboards in the Operata app render contacts, agents, cohorts, and the insights raised against them.
- Heartbeat and the Virtual Agent place and answer synthetic calls, so you measure the path end to end before a real customer hits the fault.
- The API returns contacts, observations, insights, and logs, and Amazon EventBridge is the event path out. Operata publishes contact-lifecycle, insight, and Heartbeat events to a partner event bus in your AWS account, and you route them with standard EventBridge rules — to Lambda, SQS, Step Functions, or an HTTP API destination.
Core — observability
The CX telemetry pipeline. It traces interactions across CX platforms, monitors carriage, networks, VDI, and employee devices, captures and analyzes employee experience, and traces real-time AI agents and their handoffs. It turns all of that into CX domain insights, deviations from baseline, and the context graph of domain knowledge for IT and Ops. Each collector emits signals — single timestamped measurements. Core ingests a signal, correlates it with the contact it belongs to, applies redaction and validation, and persists the result as an observation. Signals flow; observations are stored. A contact is the per-platform record observations attach to. The insight engine reads the observations on each contact and writes an insight when a known pattern matches — audio one-way, packet loss, agent inactivity, and the rest of the insights catalog. Customer Journey Trace sits above contacts: when one customer crosses more than one platform, each platform’s contact is one span of a single journey.Sources — integrations
The raw telemetry the platform is built on: logs, events, traces, metrics, metadata, and activity, drawn through 50+ Voice AI, CX AI, and CCaaS integrations. See the full list.Why Operata splits signals from observations
The split isolates the wire format from the storage format. Redaction, deduplication, late-arrival reconciliation, and per-account validation all happen between the two, so the value a collector reports is not the value a consumer reads. CTRs can land 5–20 minutes after a contact ends; storing observations means a query returns a coherent partial view that fills in as more signals arrive, instead of a stream of half-correlated events. It also means Core can add a new collector without changing anything above it. A new platform emits signals in its own shape, and the observations that reach Surface and Tenor keep the shape consumers already build against.Related
- Signals and observations — what each collector emits and how Operata stores it.
- Contacts and interactions — the per-platform record observations attach to.
- Customer Journey Trace — how Operata links contacts across platforms.
- Insights — the named detections Operata derives from observations.
- Choose your integration — the platforms Operata collects from.