
Step 1 - Contact your Operata Customer Success Team
Use the Operata widget, email or Slack to let Operata know which Operata Group you need to create Custom Dashboards in - this gives you permanent access to edit the dashboards you have created. The Operata team will contact you when you can create your own and the Dashboard administration url you need to use.Step 2 - Login to the Operata Group
Login the to the specific Group you want to create custom dashboards in at Admin level. From a new tab access the Dashboard administration area:- AU hosted customers - https://bi-admin.operata.io/
- US hosted customers - https://bi-admin-us-east-2.operata.io/
Step 3 - Create/edit your Custom Dashboard in the bi-admin area
Select the Dashboards tab to see the latest Operata curated dashboards - copying and editing these, or the charts within them is often the best place to start.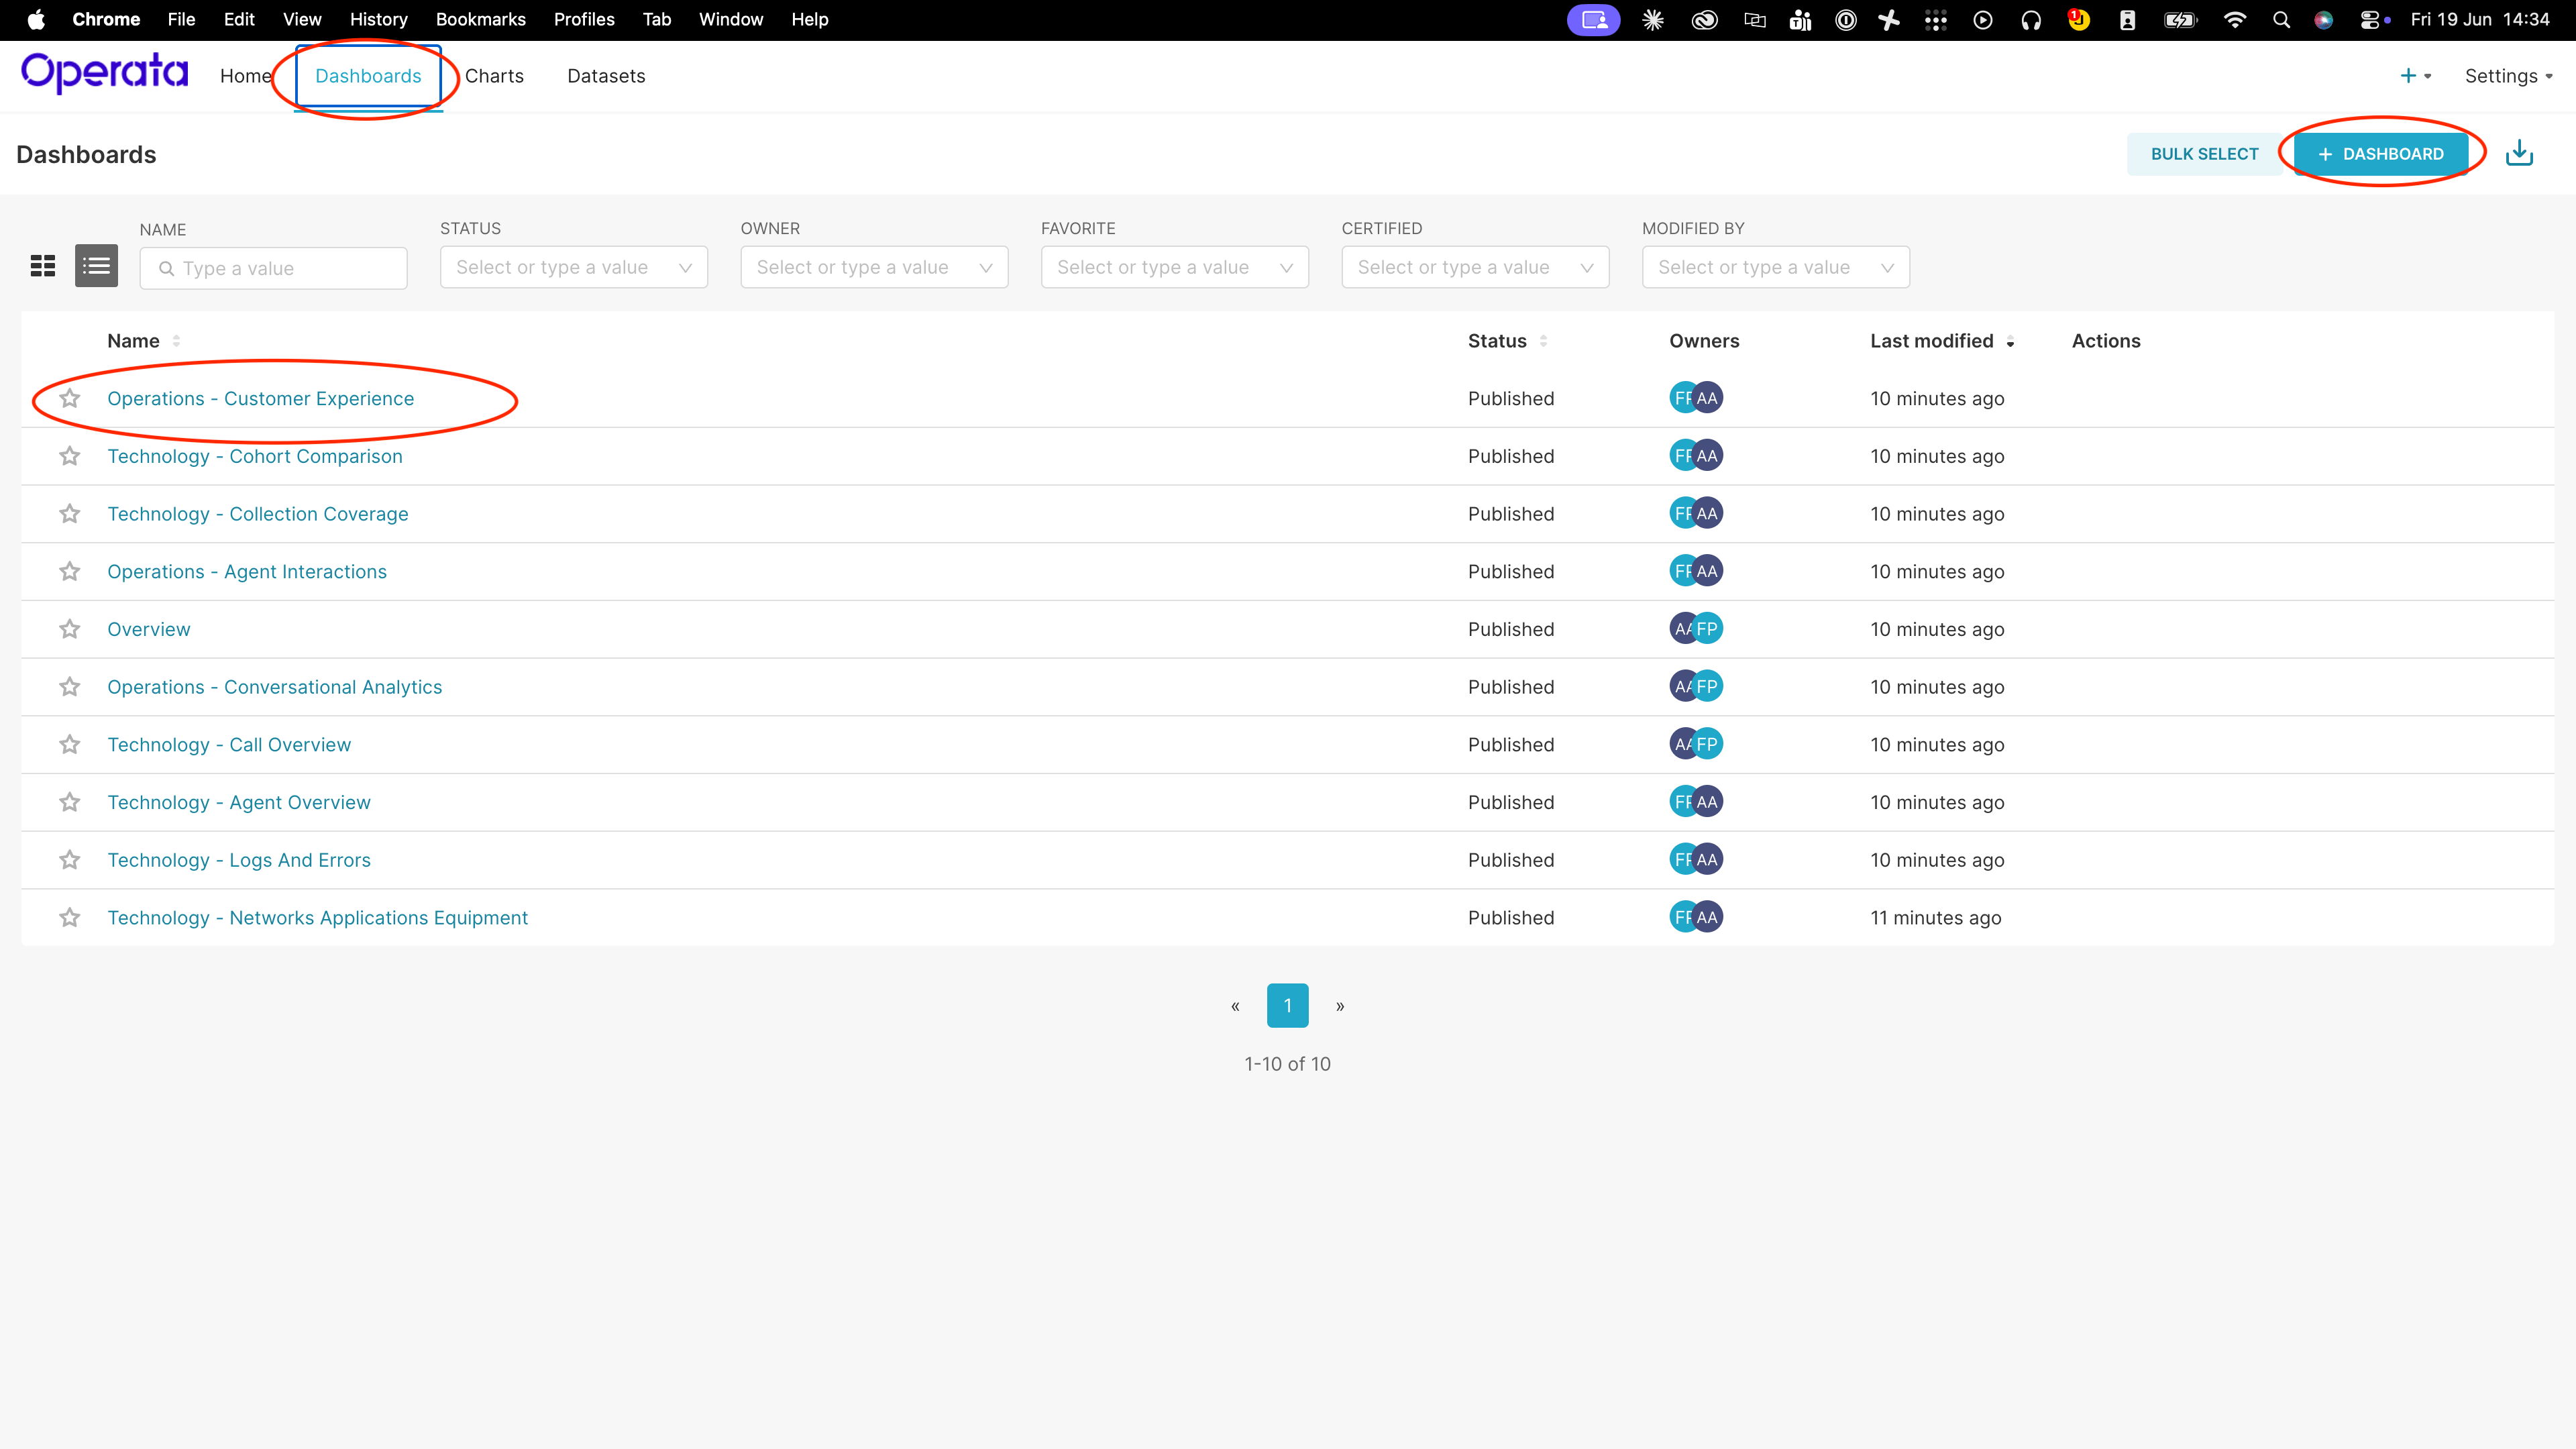
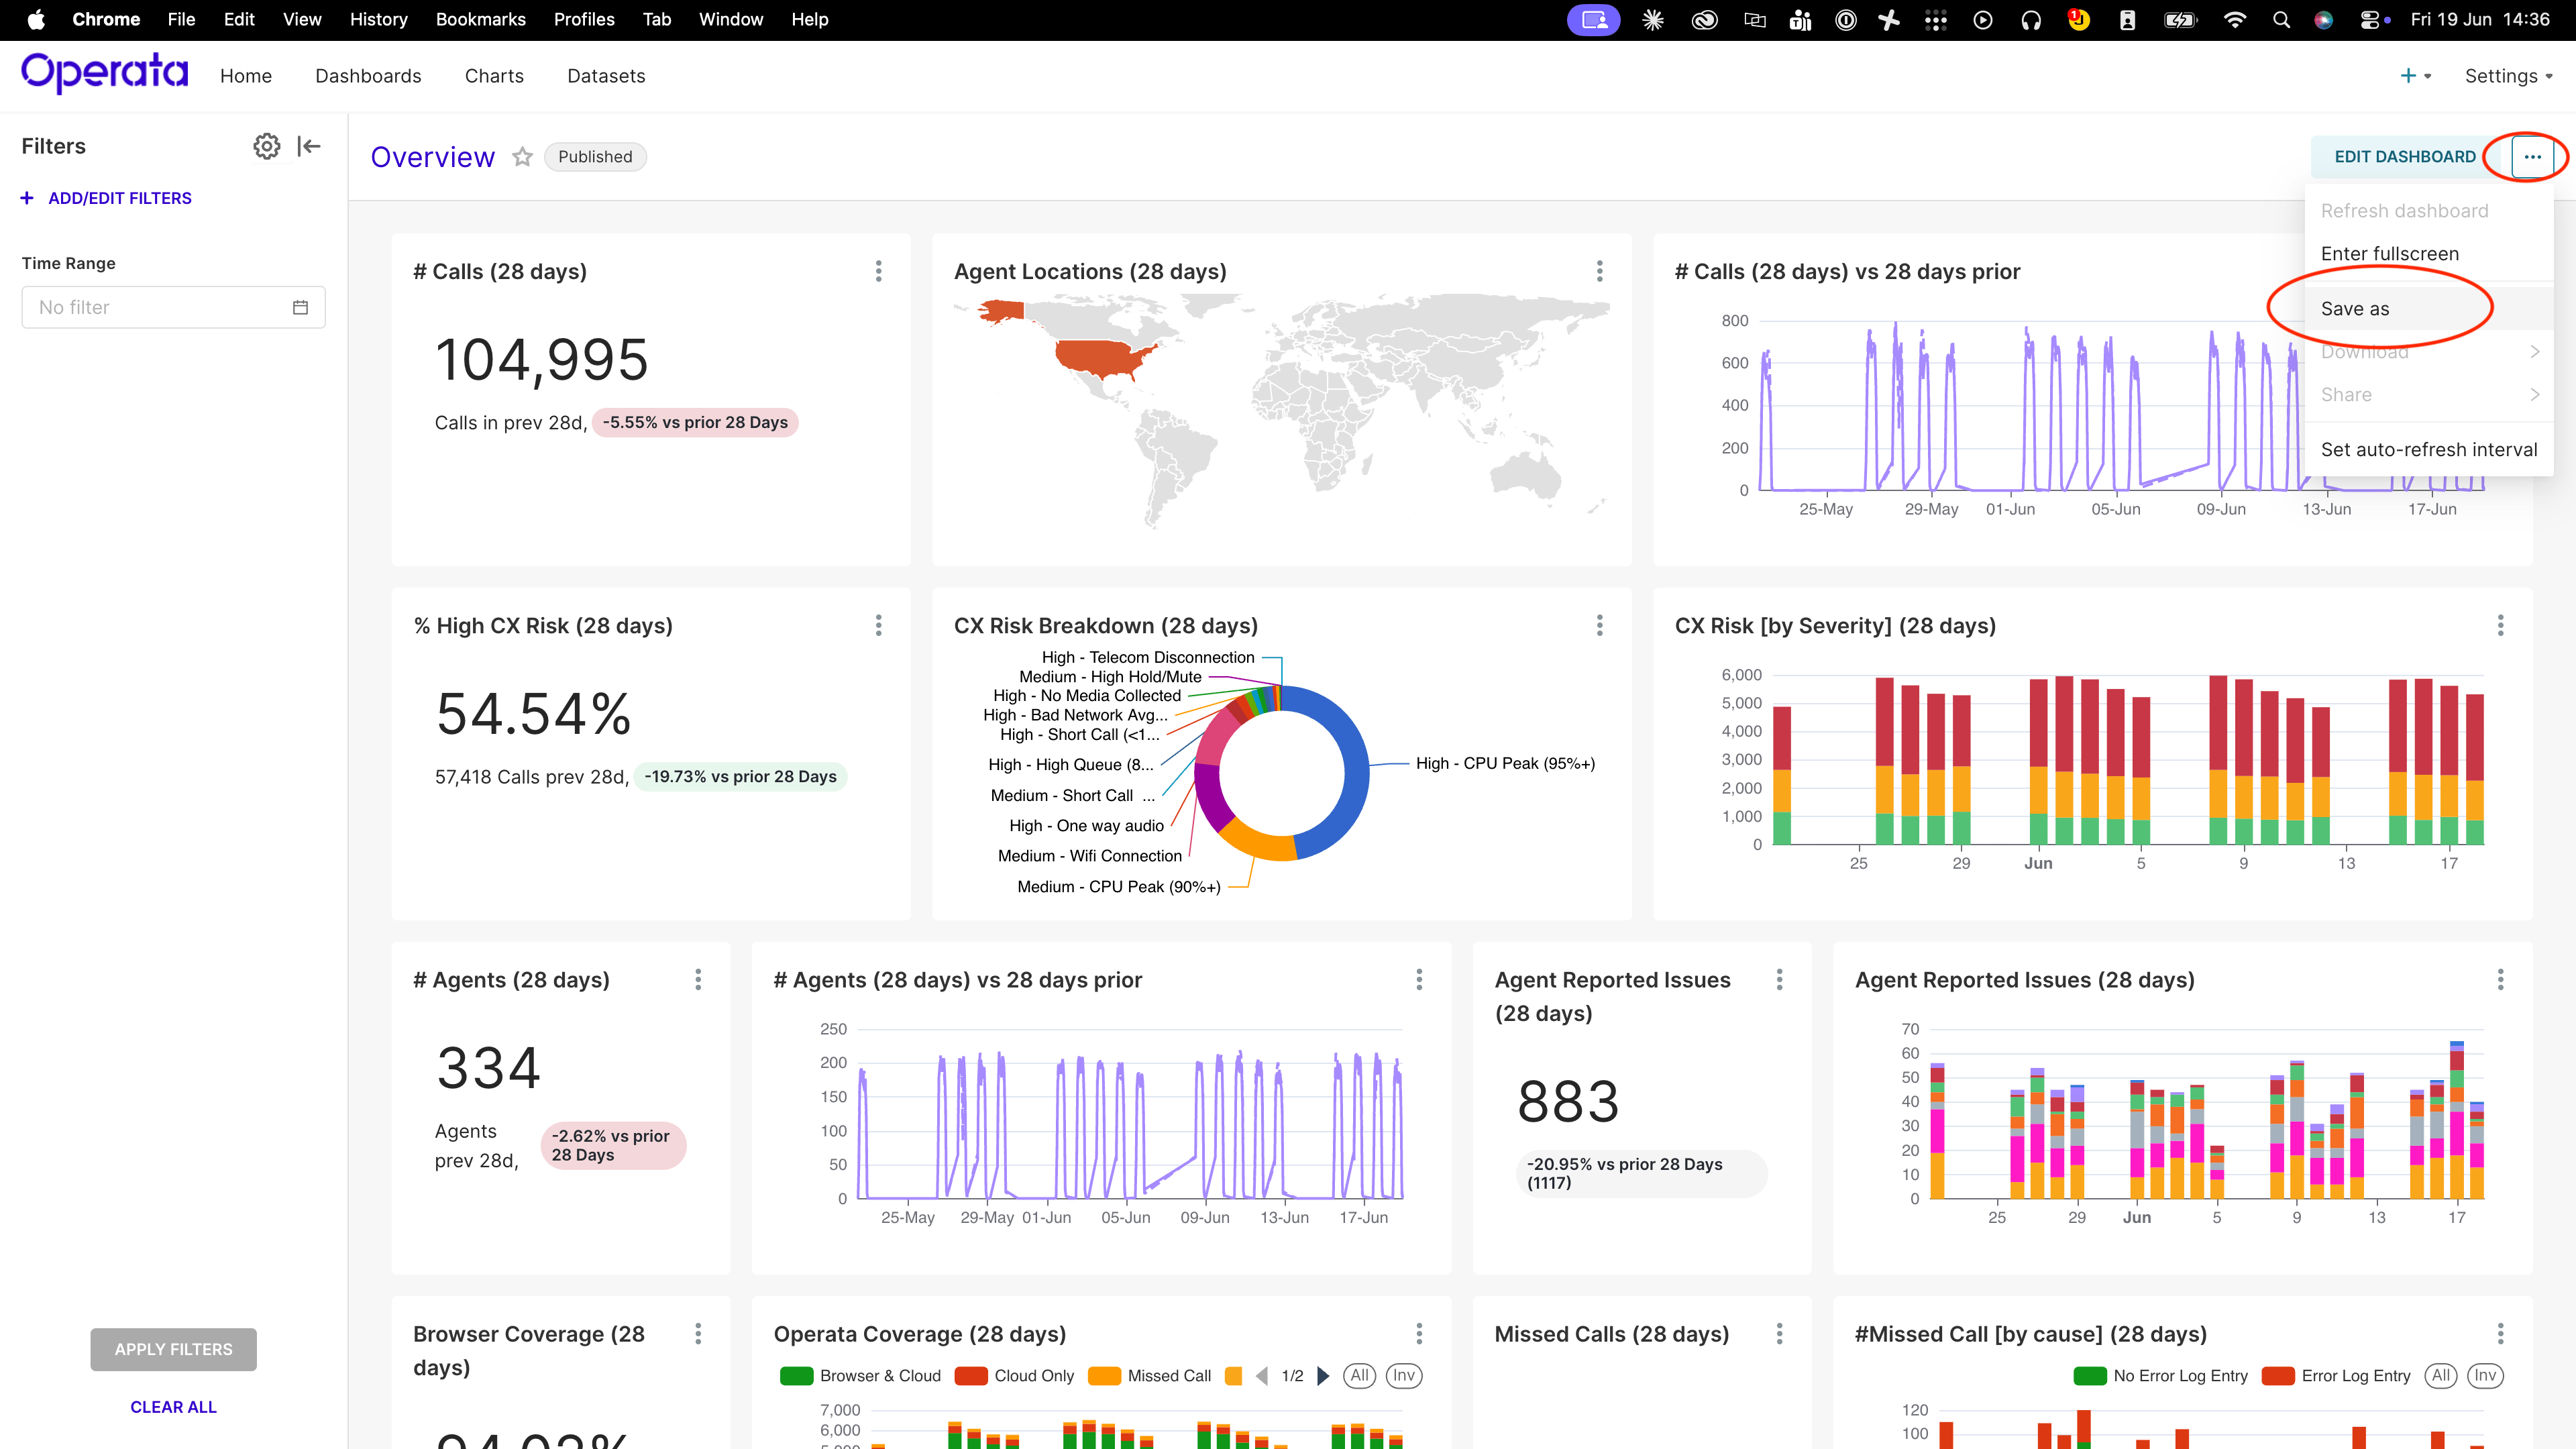
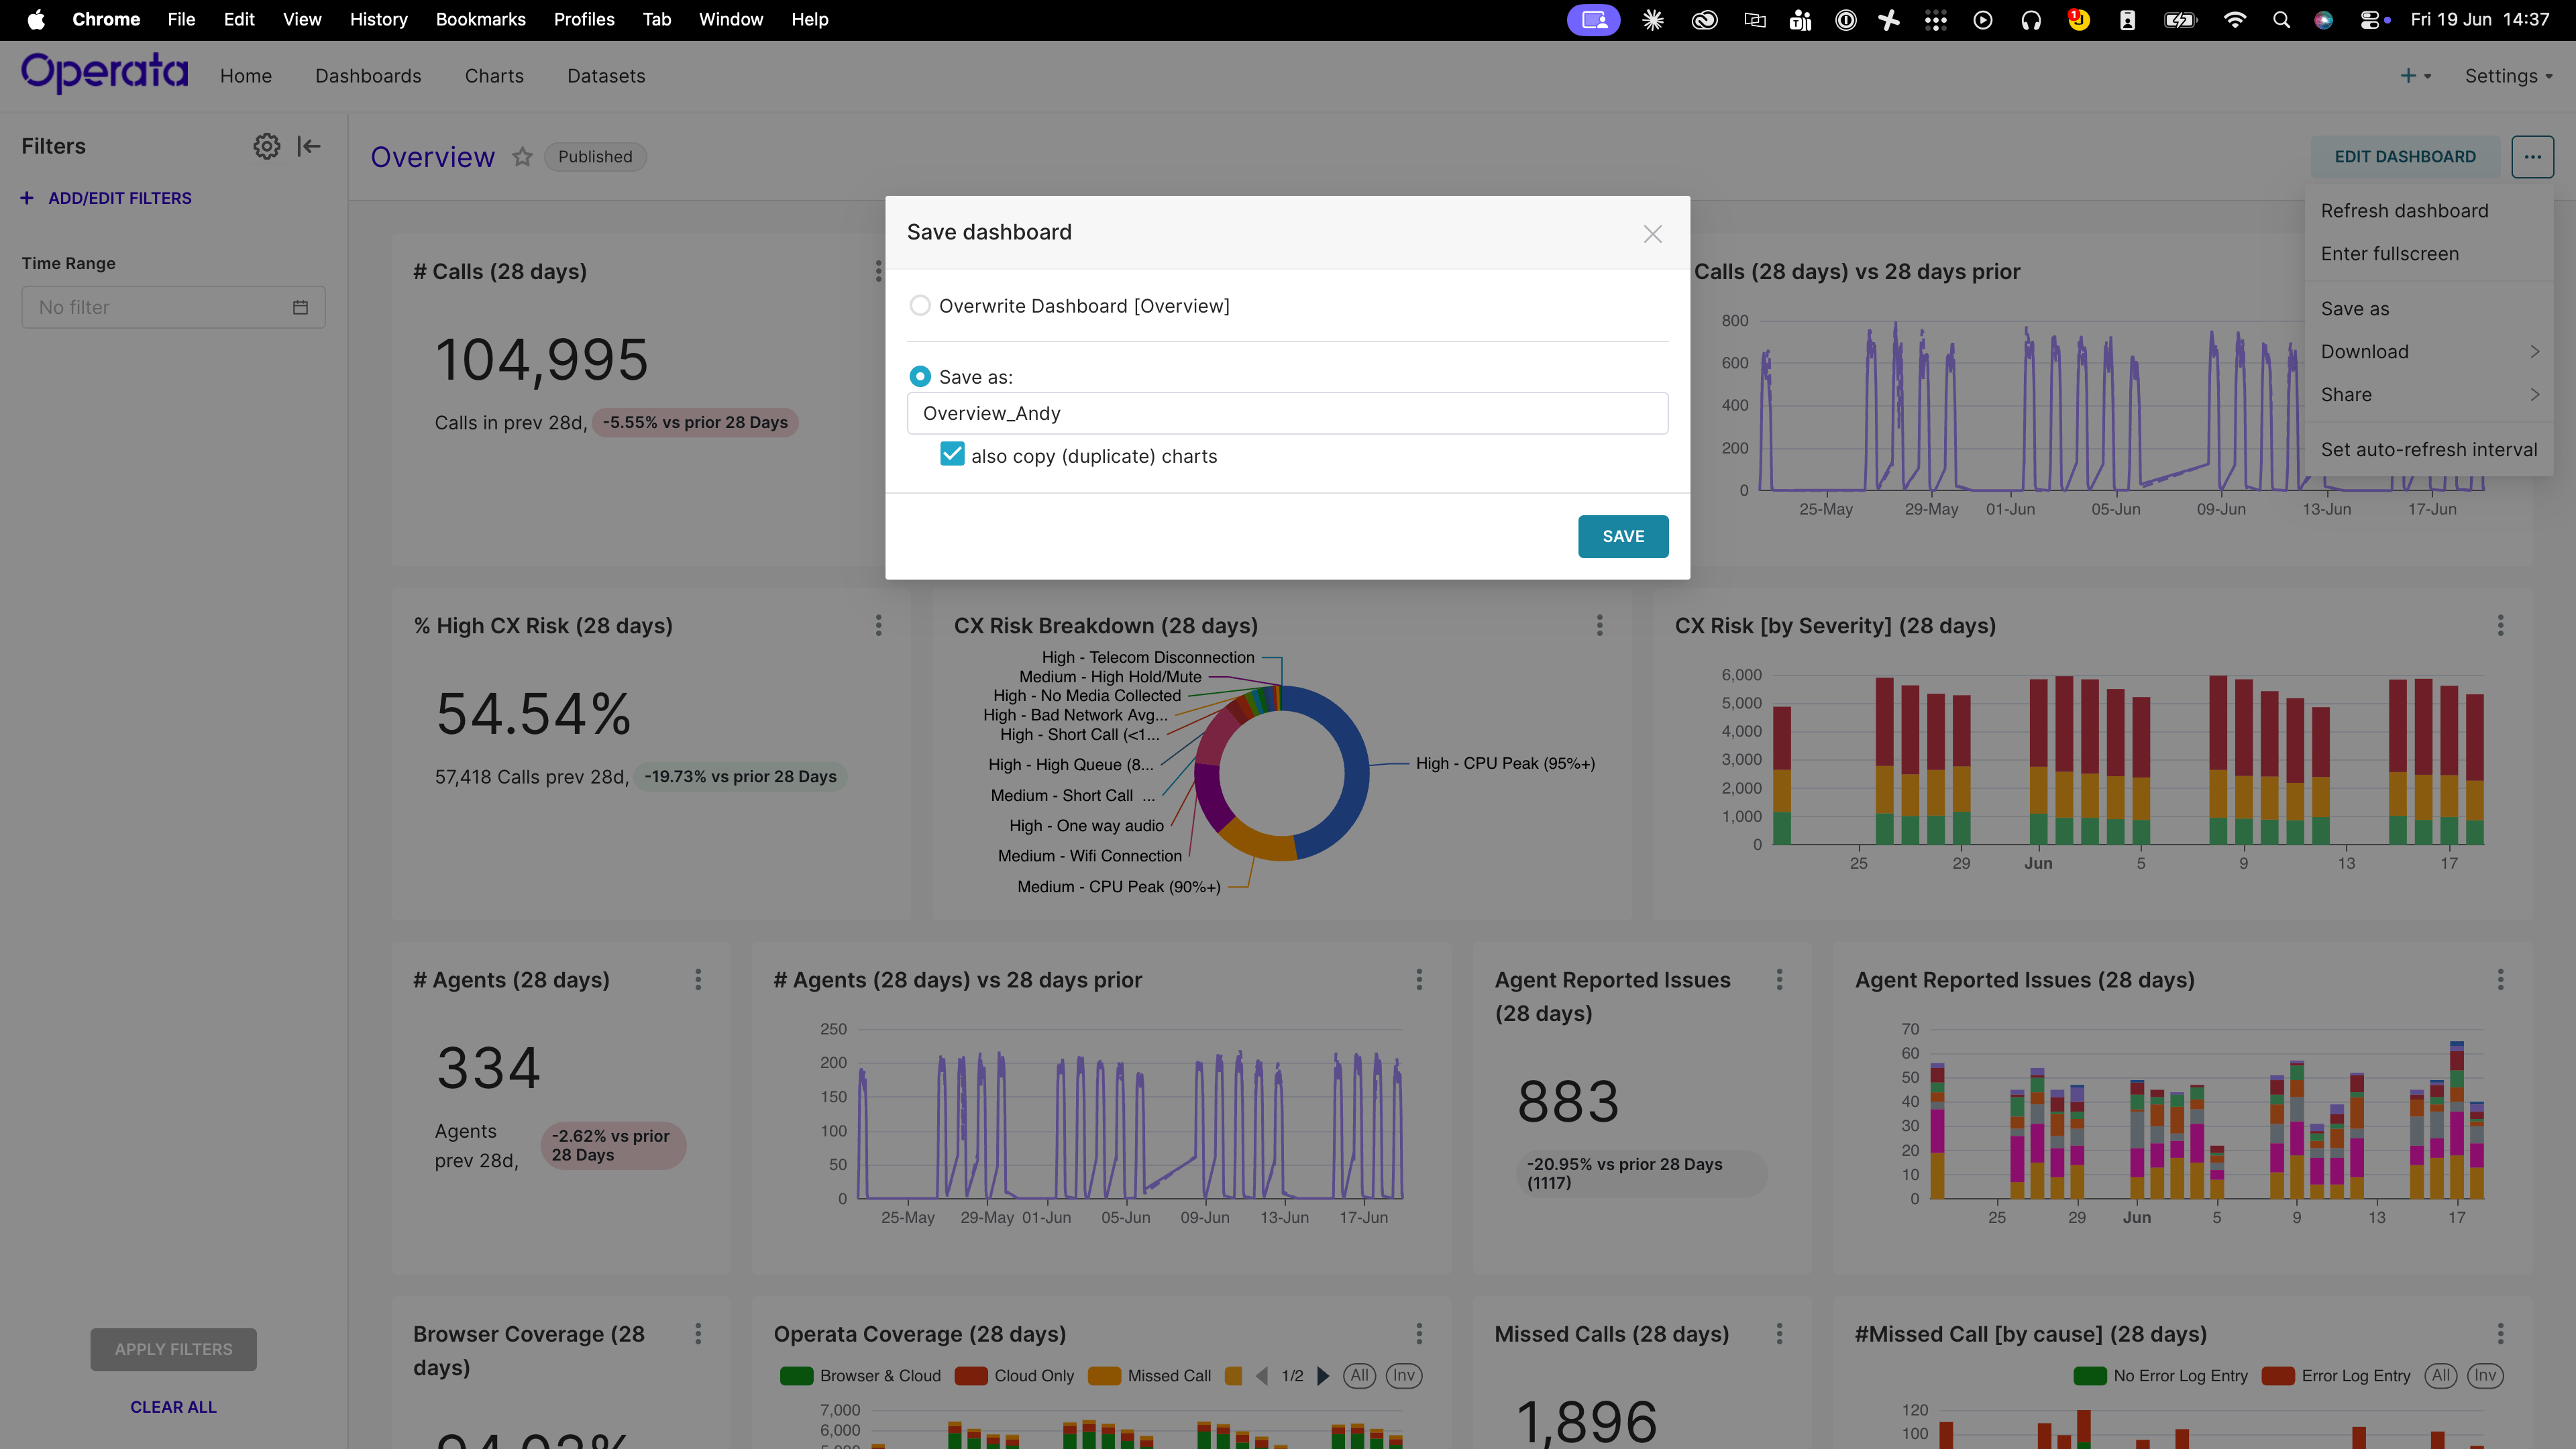
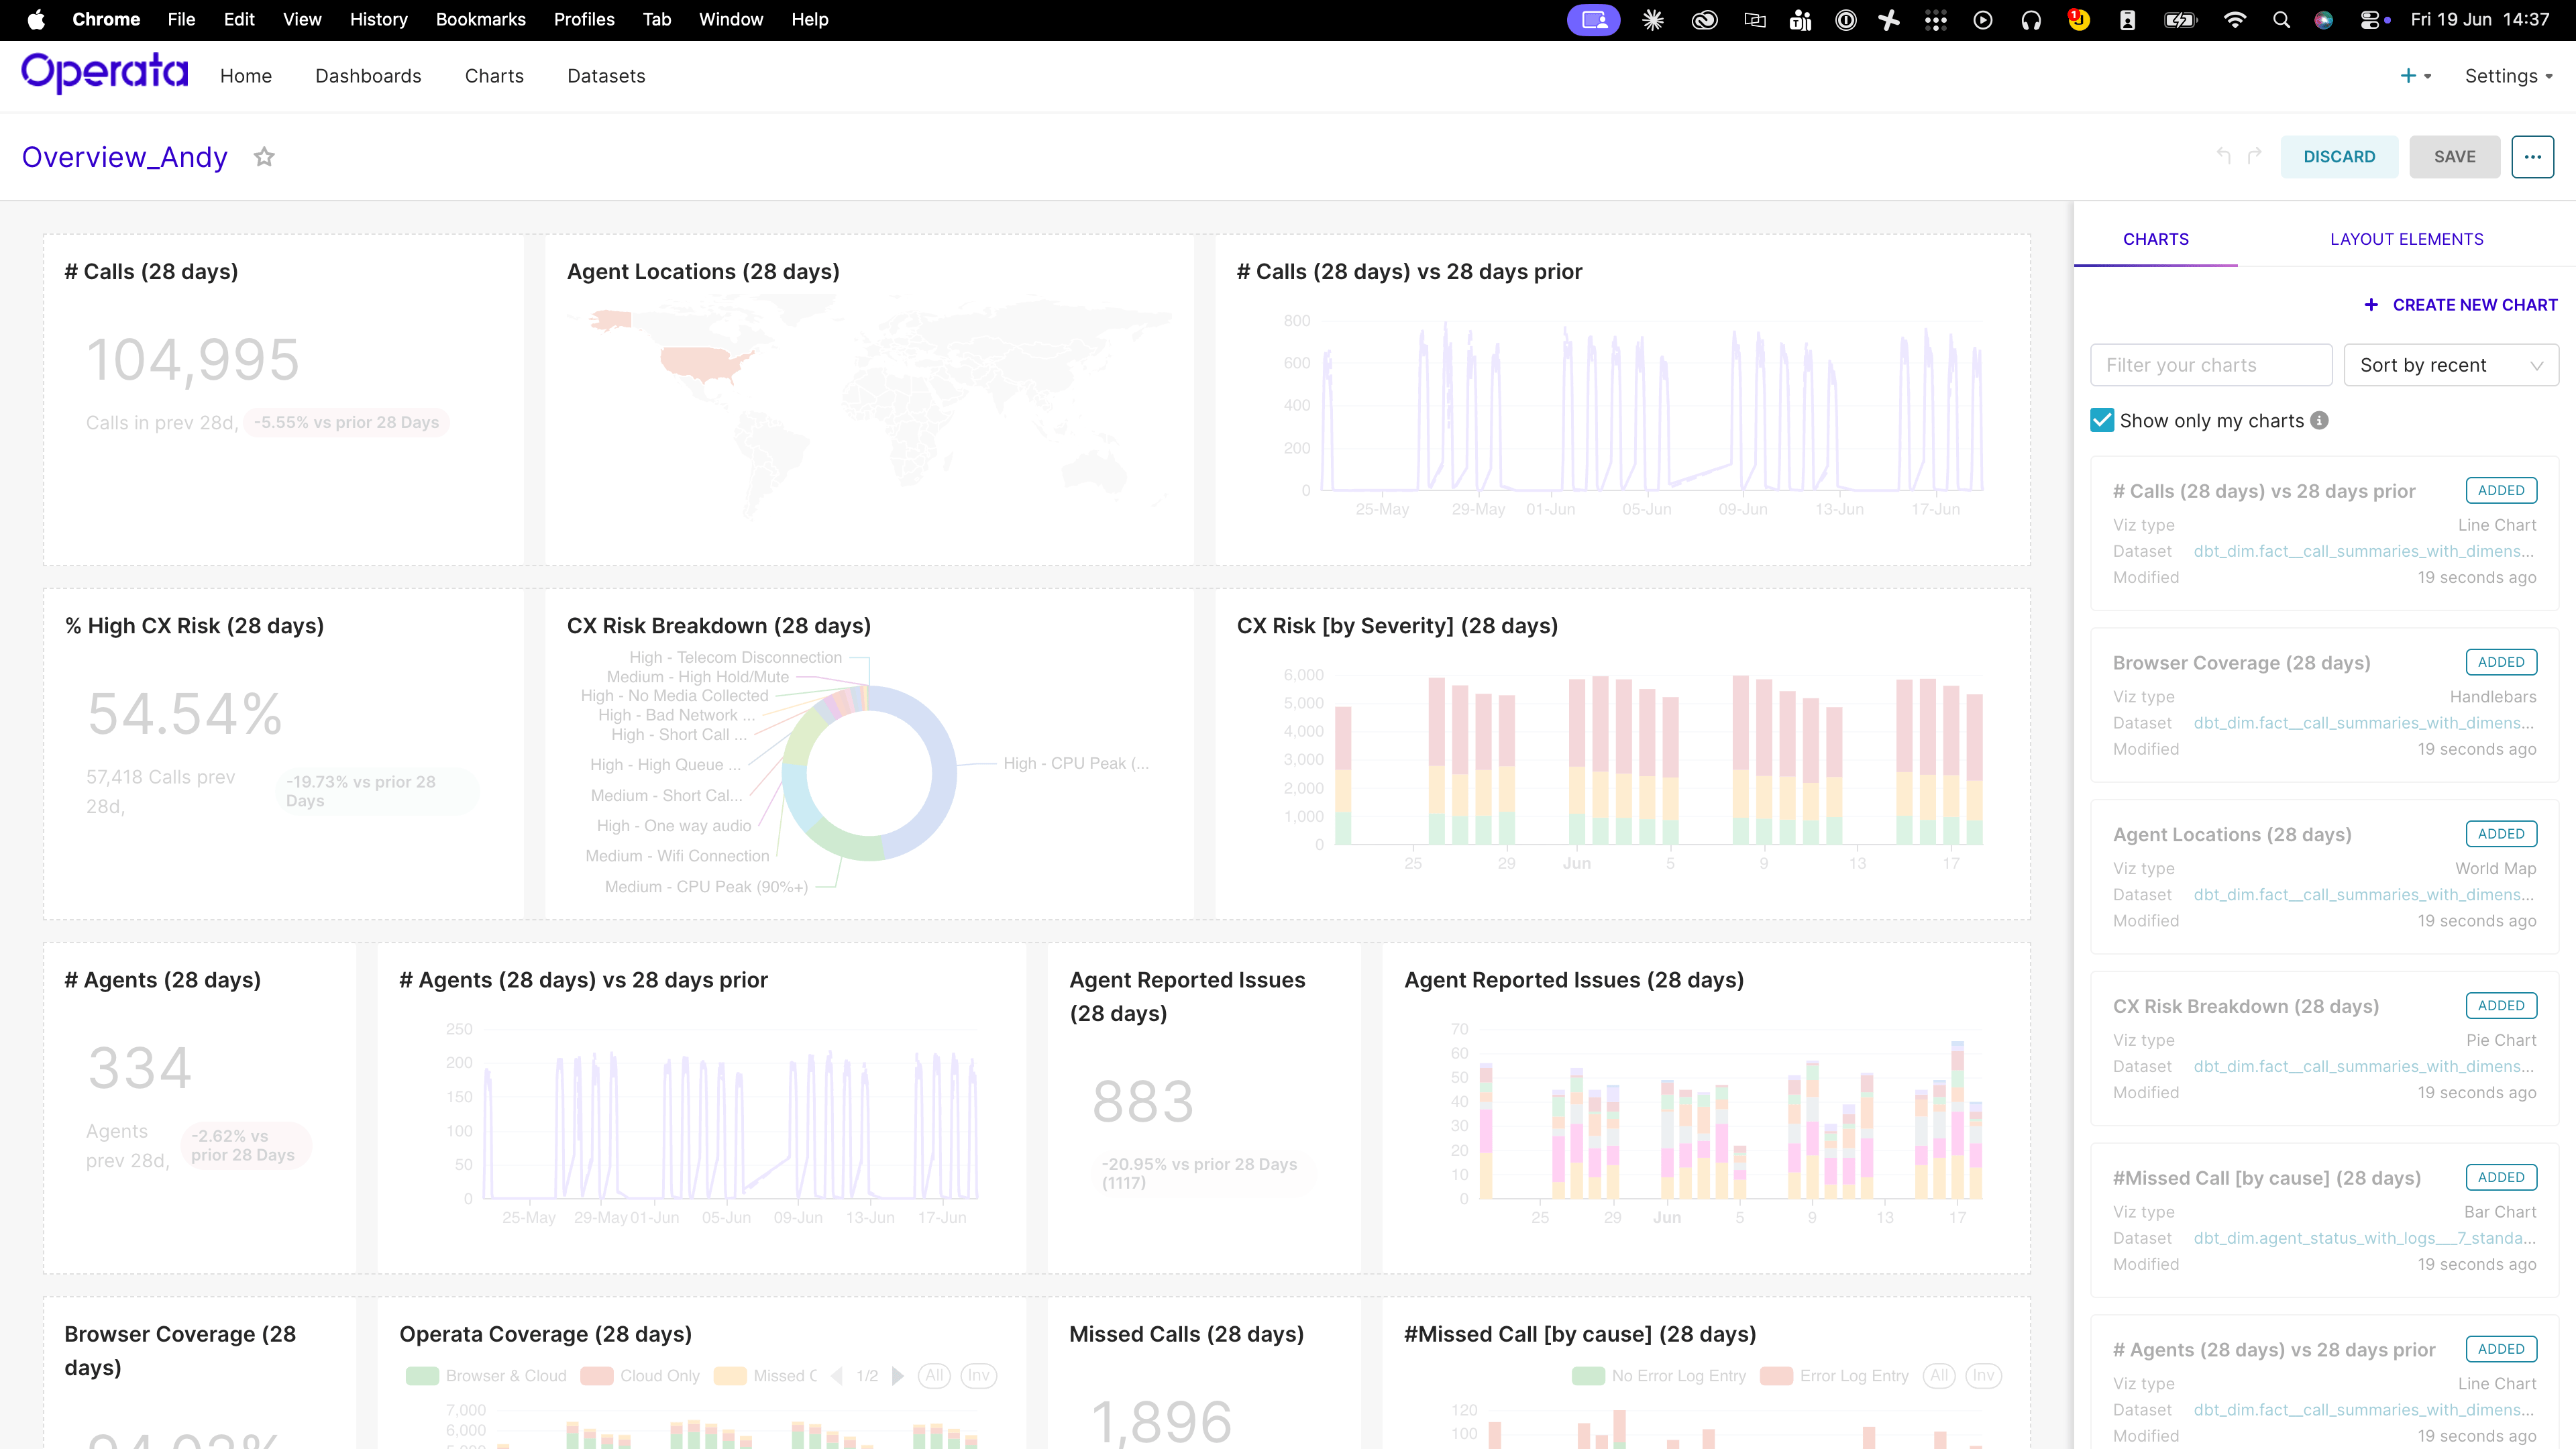
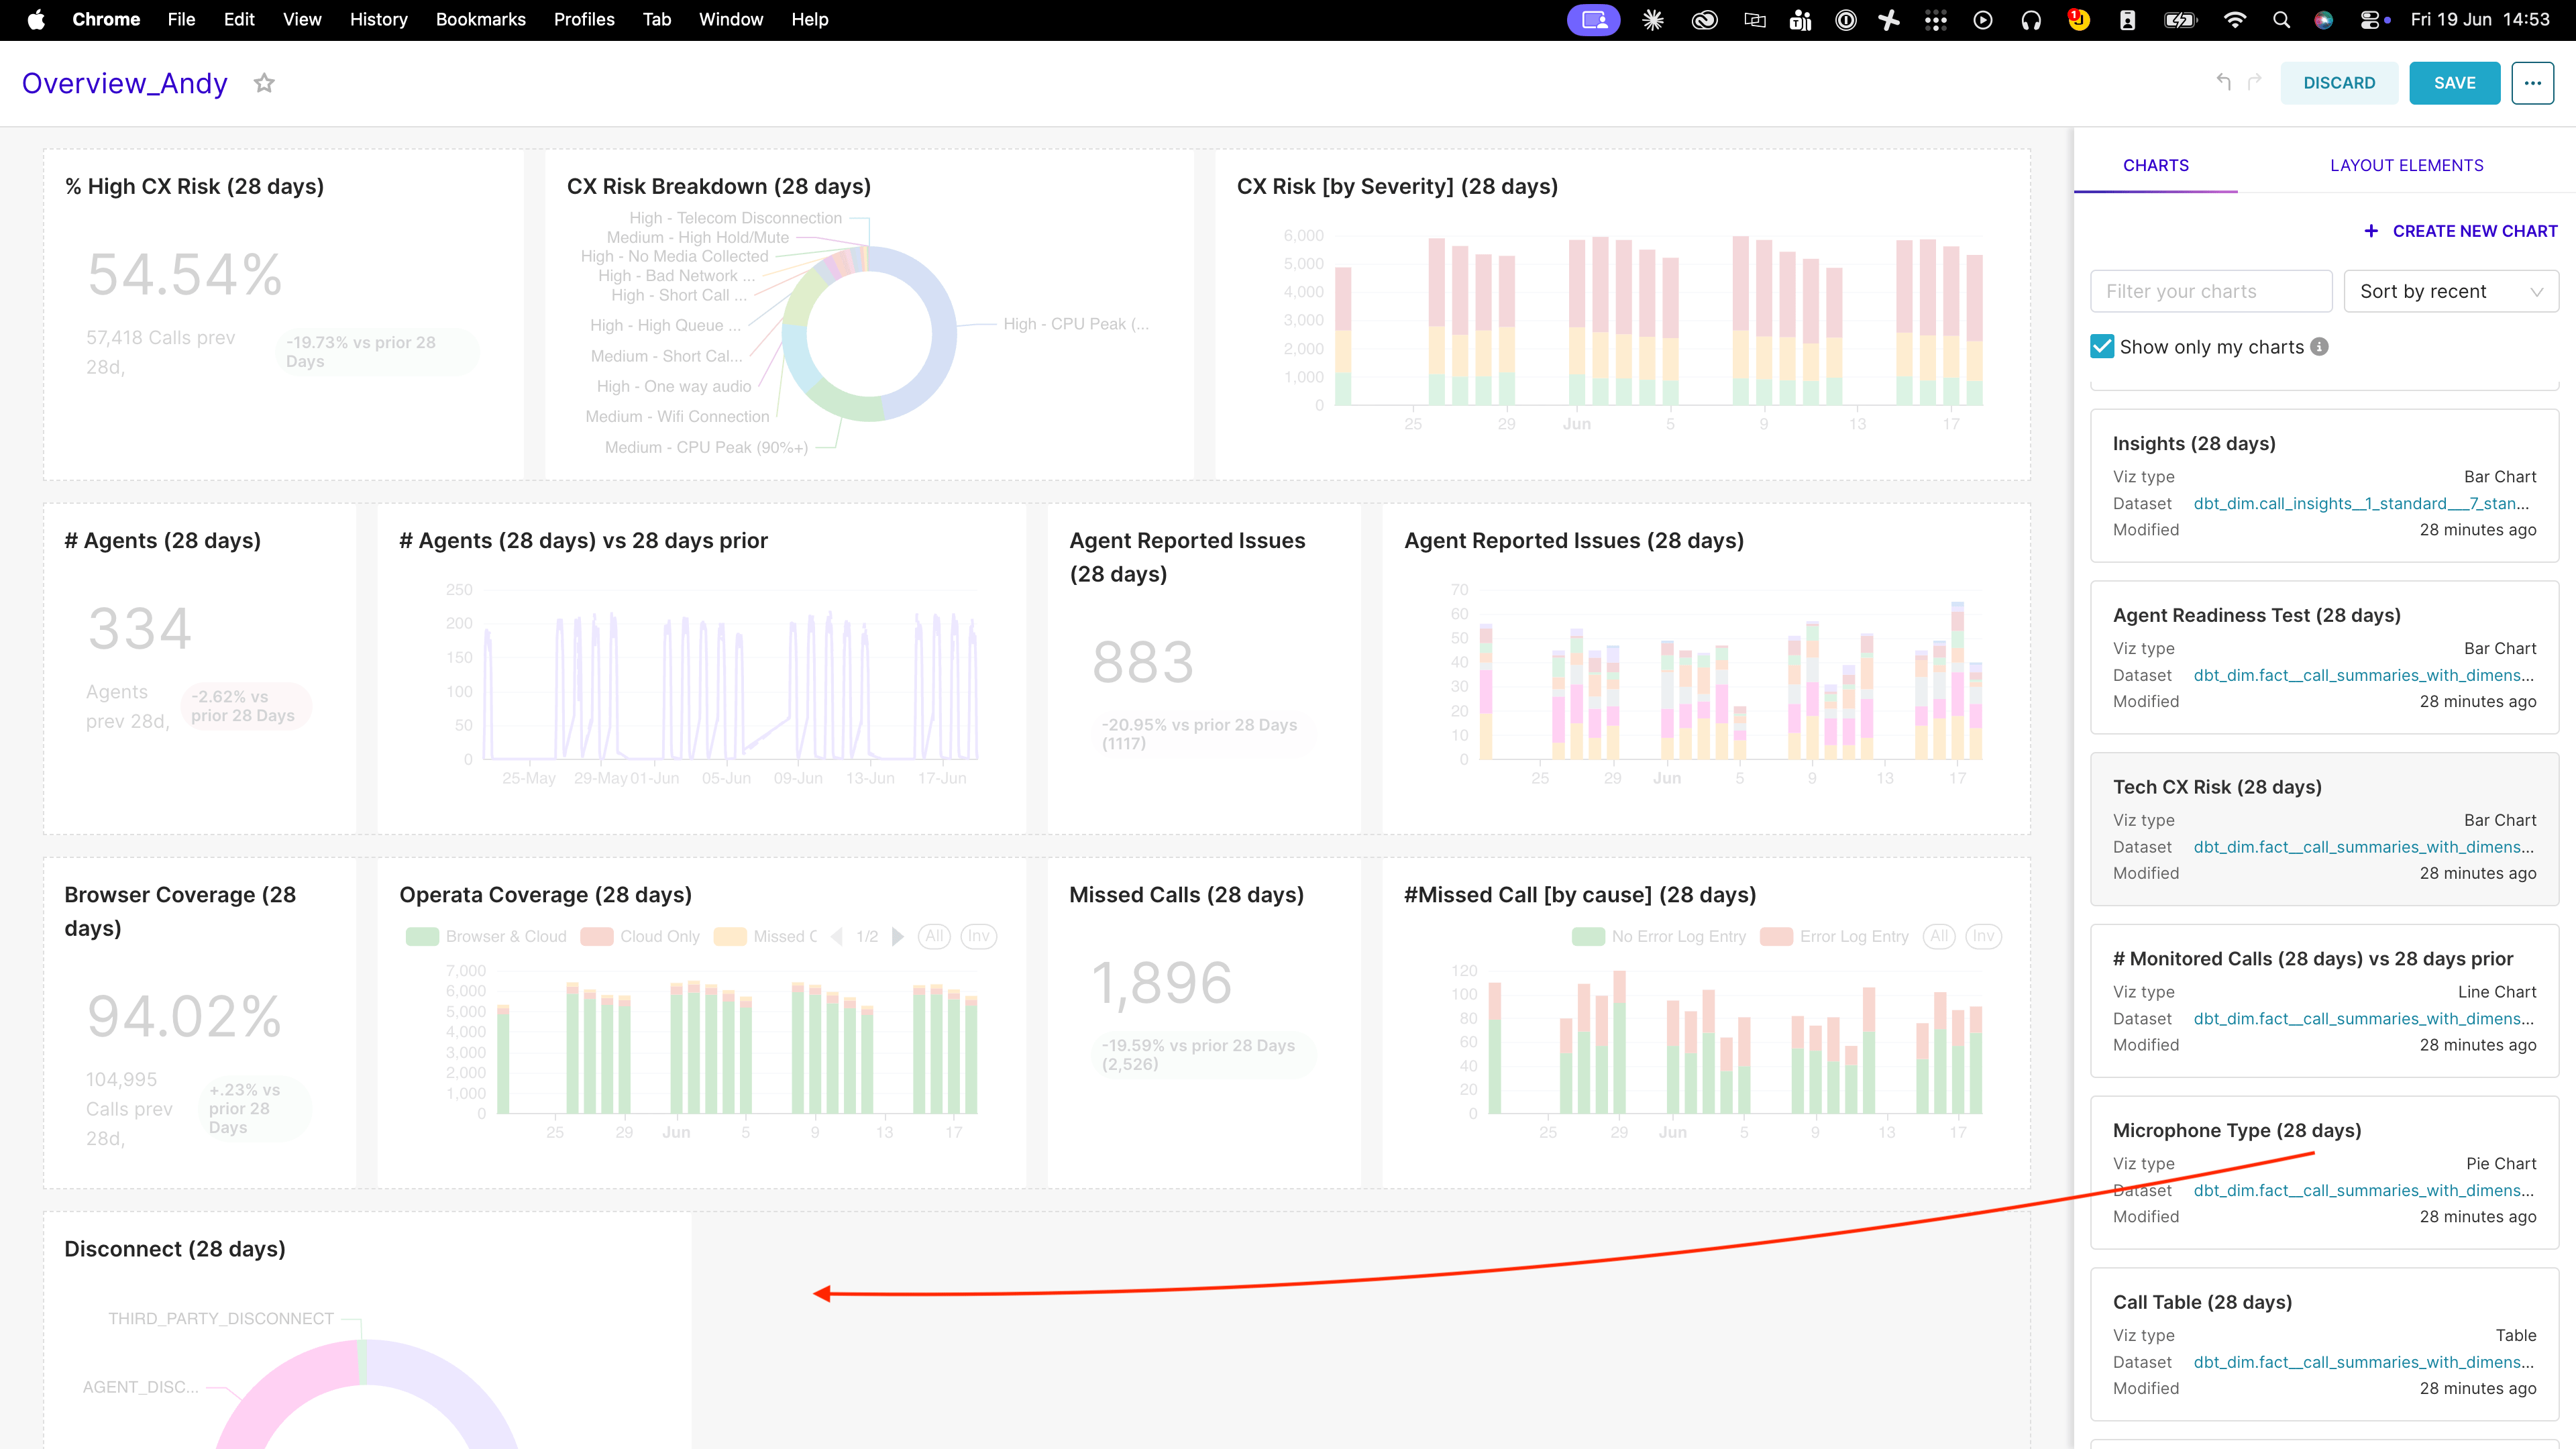
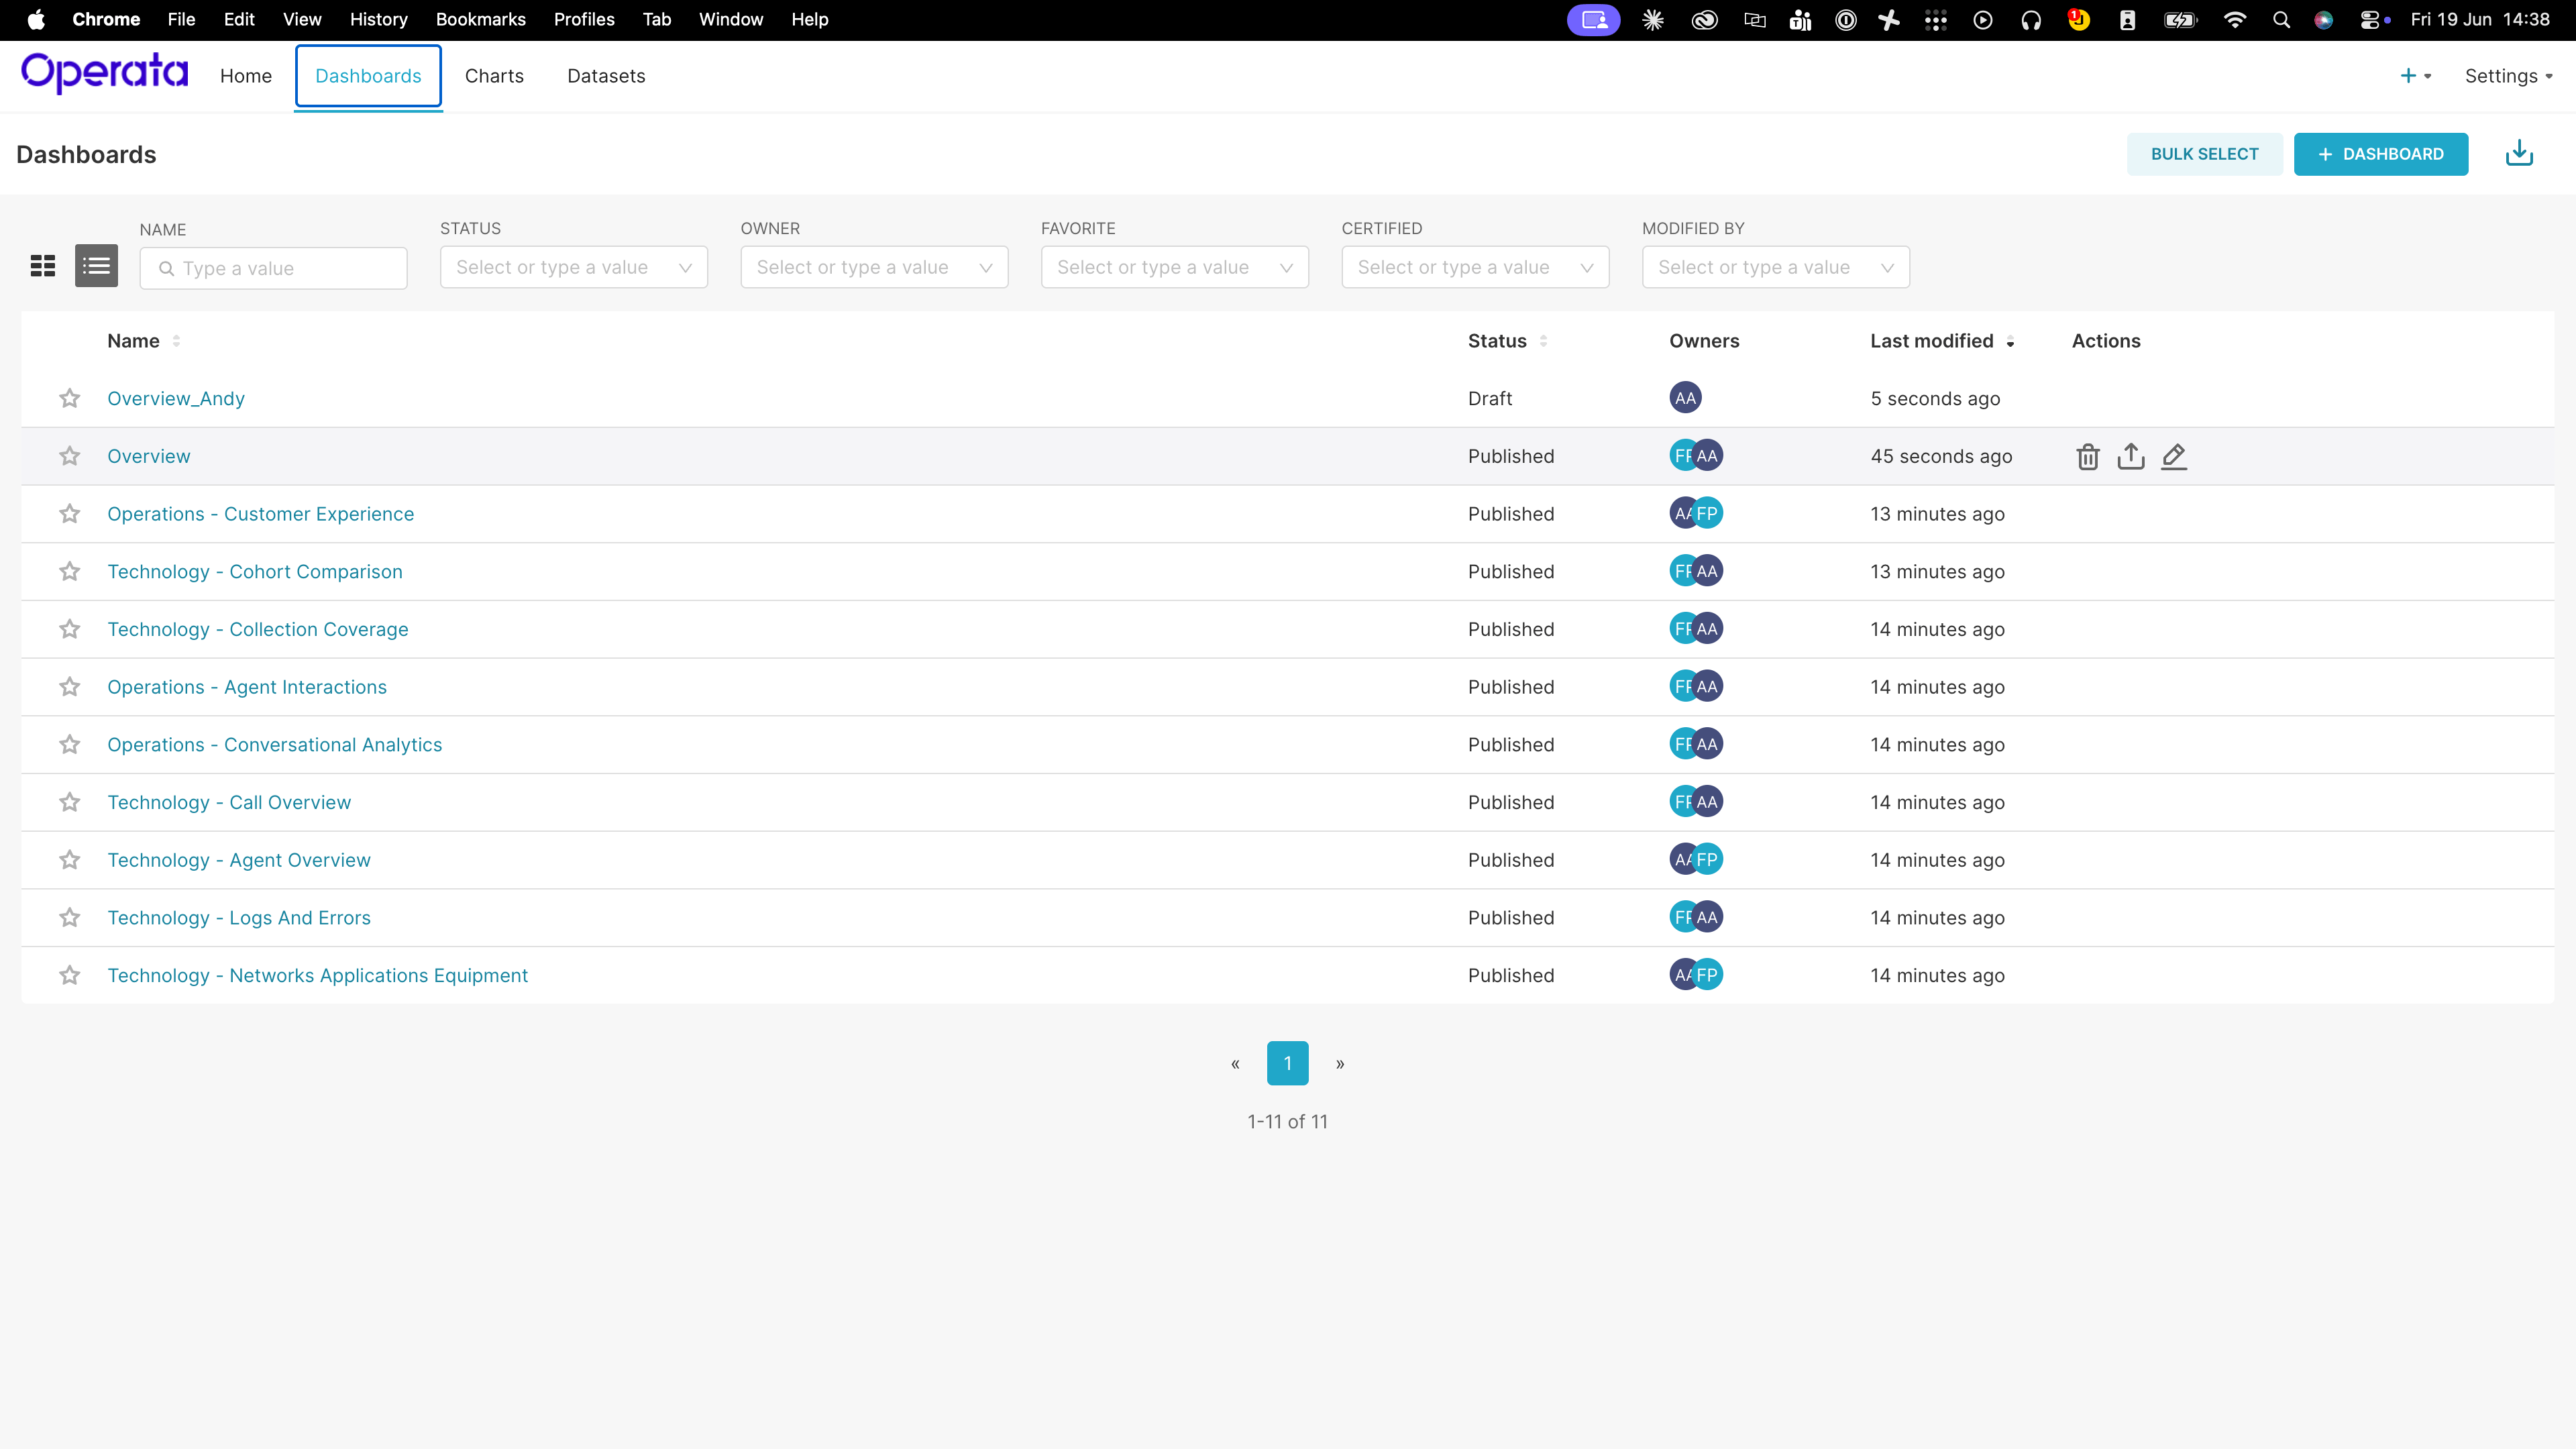
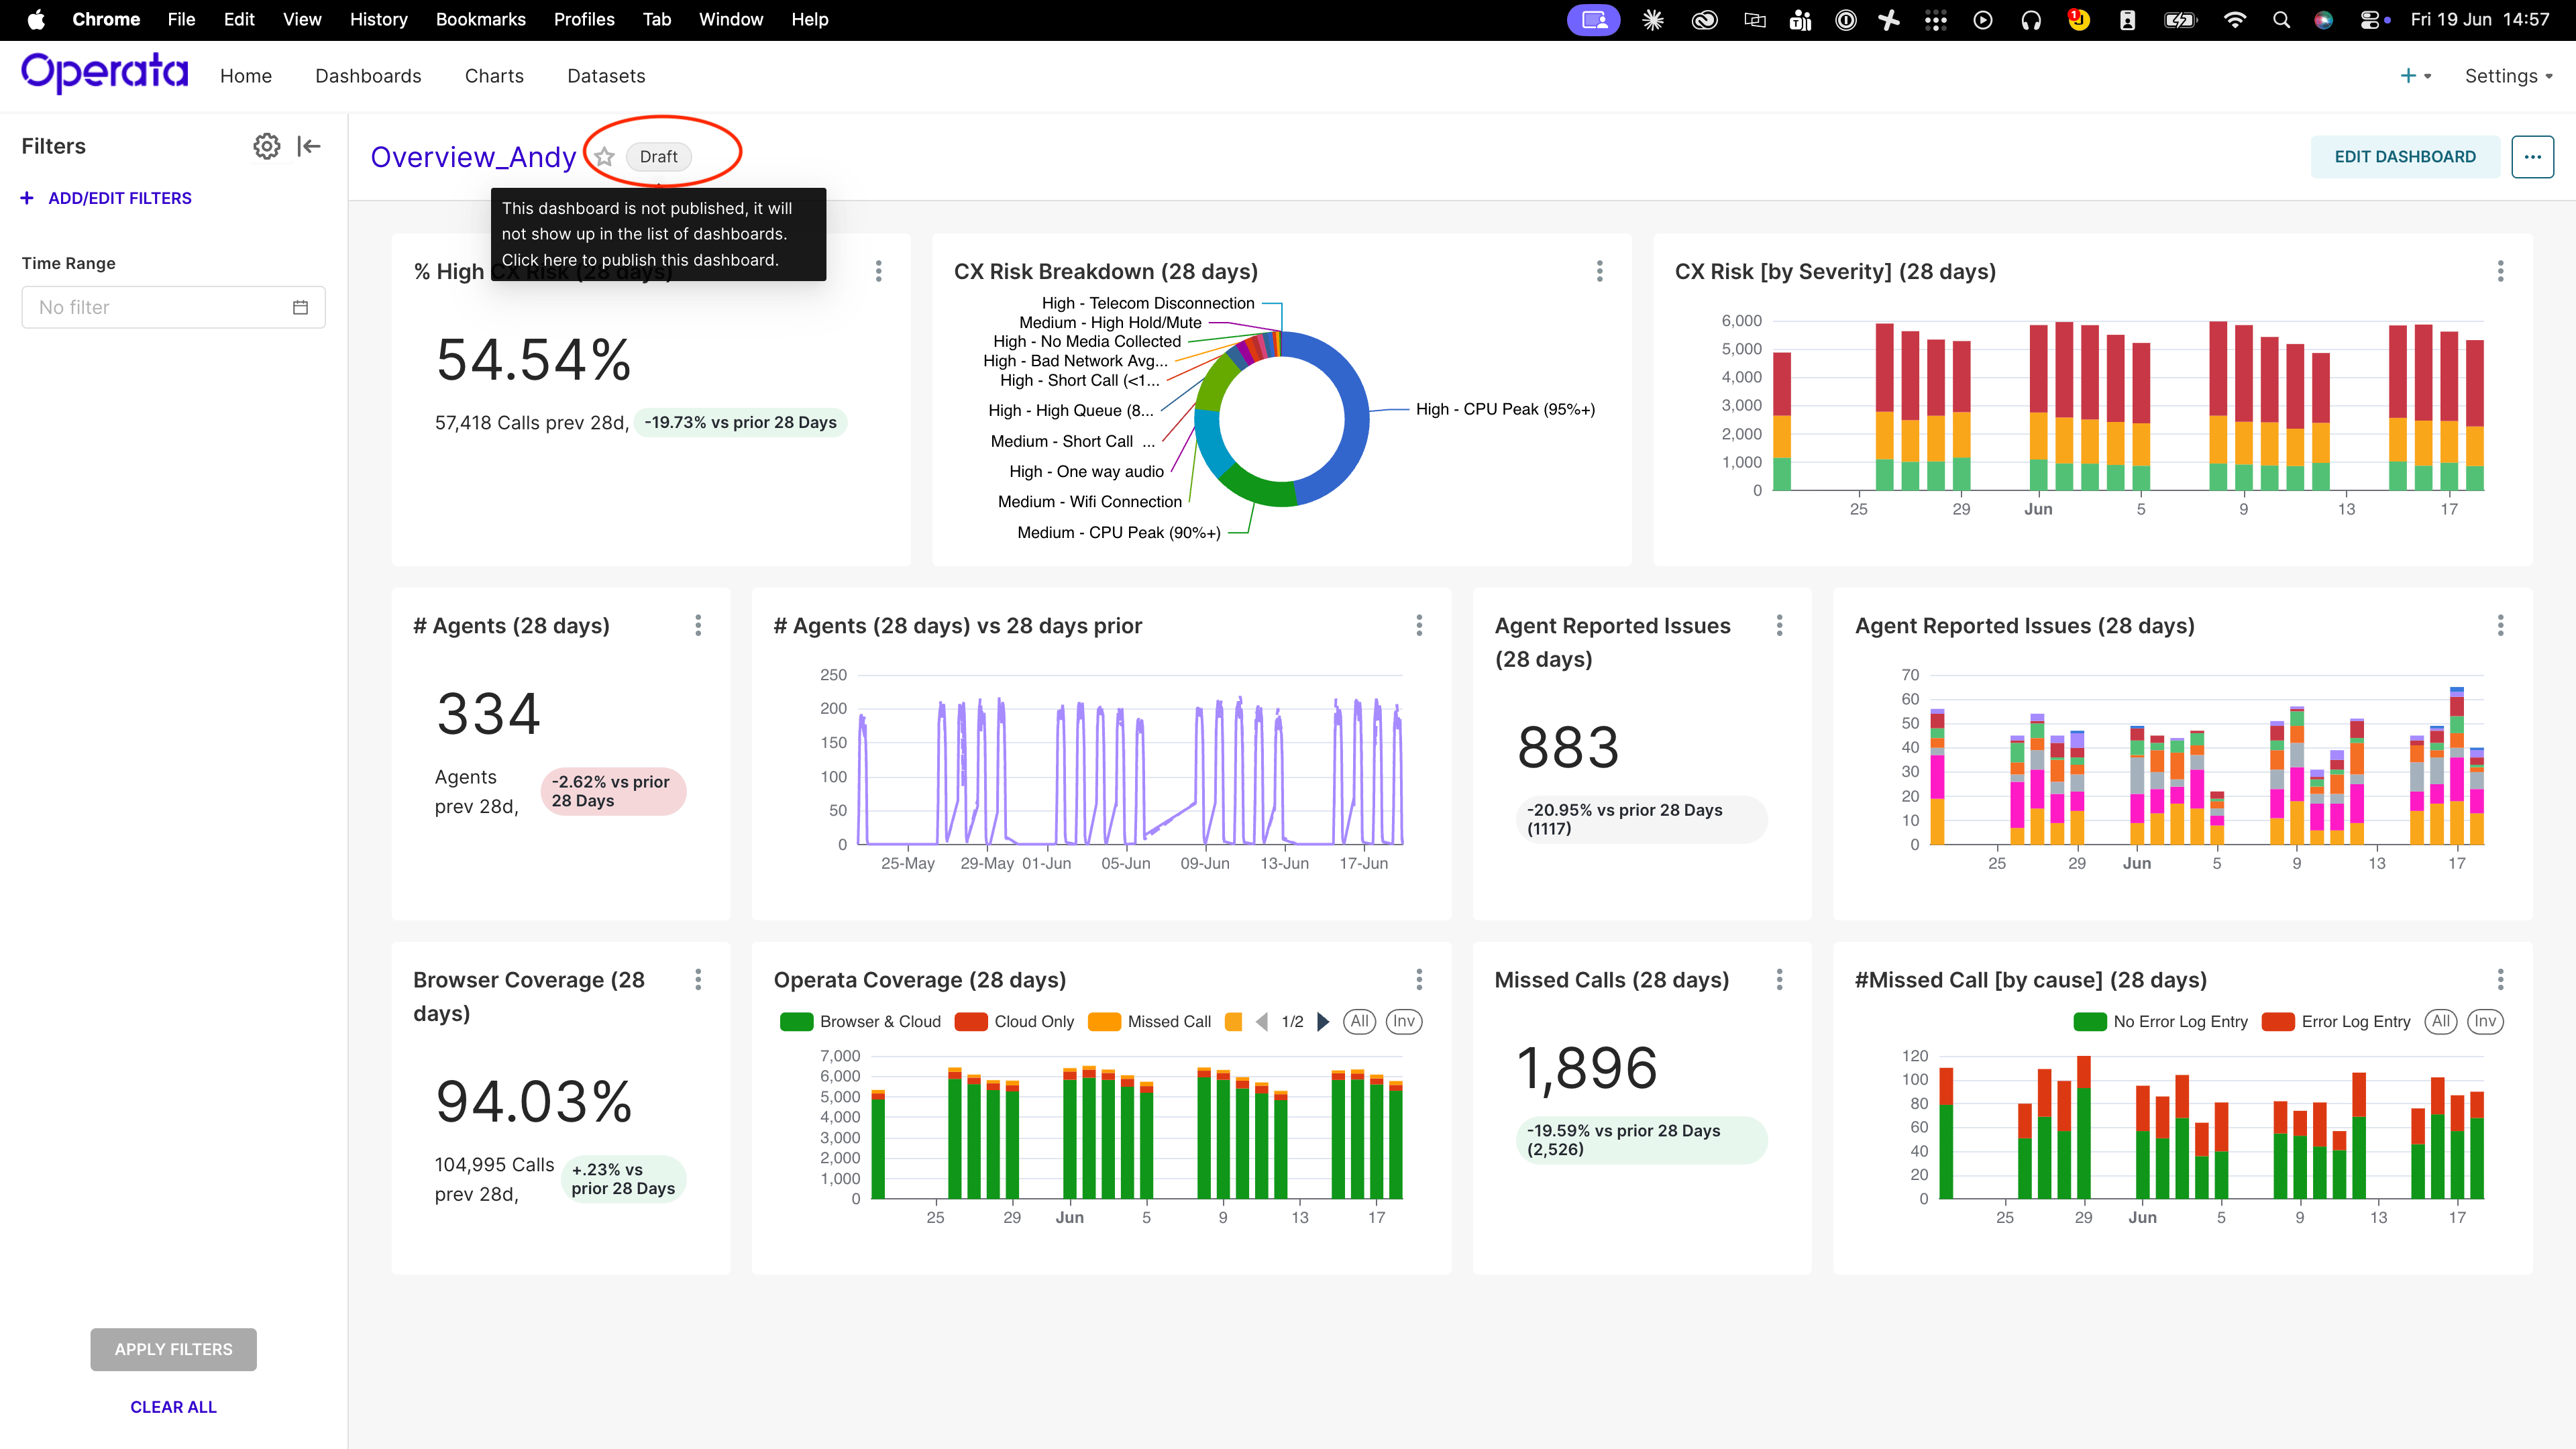
Step 4 - Contact your Operata Customer Success Team
Use the Operata widget, email or Slack to let Operata know the Group and Dashboard name you want published. The Dashboard will appear in the drop-down list of dashboards.Data table mapping from Canvas to Dashboards
Migrating custom dashboards from Superset 1 (Canvas icon) to Superset 4 (Dashboard icon) is a manual process. As there is no direct mapping between the data tables, the best option is to use the Operata curated charts as a starting point and the schema for details of the table contents. The fact tables are the most commonly used data sets- fact__call_summaries_with_dimensions
- fact__call_events_with_dimensions
- fact__agent_status_with_dimensions
- fact__contact_lens_with_dimensions
- fact__agent_reported_issue_with_dimensions
- fact__softphone_logs_with_dimensions
- prior_call
- next_call
- surrounding_calls
- surrounding_agent_status
- surrounding_logs
- call_insights
- agent_status_with_logs
- calls_with_headsets
- contact_lens_with_attributes
- dim_agen
If there are any issues please contact your Operata Customer Success Team.